 Skip to main content
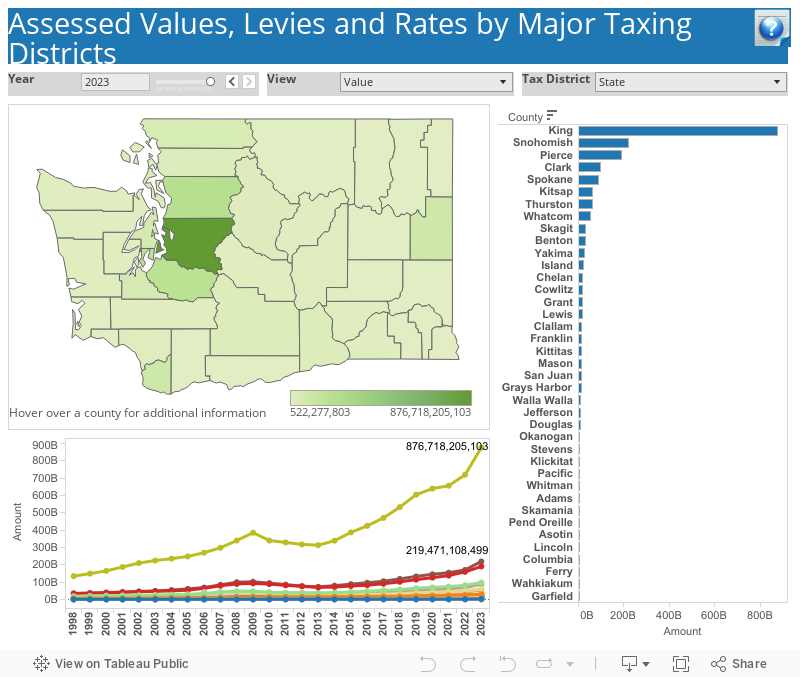
This interactive data graphic presents information from the property tax statistics. Hover over a county on the map or bar chart for more details, and immediately see the data change.
The graphic includes data from 1998 through the latest data published, and allows you to select a view of:
- Levy
- Rate
- Value
Additionally, you may choose one of these taxing districts:
- State
- County (general levy)
- County (roads levy)
- Cities
- Emergency medical services
- Fire protection
- Hospital
- Library
- Local school
- Port
Hover over the question mark in the upper right hand corner of the visualization for additional information about using charts as filters, and other filters provided.