 Skip to main content
Sixty percent required for school levies:
The comment differentiating bond authorization from levies i.e. 50 percent for bonds/60 percent for levies leads to a need to know all authorization requirements in the two categories. Is there a rationale?
The following table summarizes the requirements for the various kinds of voter-approved levies authorized by statute. There may have been a discernible rationale to these varying requirements at some time but there doesn't seem to be any longer. The only very general principle seems to be that levies that aren't made very often or extend over multiple years, such as some excess levies including bond levies, require a 60 percent plurality, while those that can come along fairly frequently, such as regular levies, require only a majority vote. The term "regular levy" means that the levy is subject to the constitutional 1 percent limit, which says that the total of all regular levies cannot exceed one percent of the market value of the property. Excess levies are not regular levies and, generally, are not limited.
Voter-Approved Property Tax Levies
| Type of Taxing District | Type of Levy | Approval Requirement | Validation Requirement | Cite |
|---|---|---|---|---|
|
Districts Except School Districts |
Excess (General) |
60 percent |
40 percent of voters voting in the last preceding general election |
RCW 84.52.052; Art. 7, Sec. 2 (a) of Washington Constitution |
|
Districts Except School Districts |
Excess (Bond) |
60 percent |
40 percent of voters voting in the last preceding general election |
RCW 84.52.056; Art. 7, Sec. 2 (b) of Washington Constitution |
|
School Districts |
Excess (General & Bond) |
60 percent |
40 percent of voters voting in the last preceding general election |
RCW 84.52.053; Art. 7, Sec. 2 of Washington Constitution |
|
Affordable Housing |
Regular |
Majority |
None |
RCW 84.52.105 |
|
Airport |
Regular |
Majority |
None |
RCW 14.08.290 |
|
Cultural Arts, Stadium, and Convention District |
Regular |
60 percent |
40 percent of voters voting in the last preceding general election |
RCW 67.38.130 |
|
Emergency Medical Service |
Regular |
60 percent |
40 percent of voters voting in the last preceding general election |
RCW 84.52.069 |
|
Mosquito Control |
Regular |
60 percent |
40 percent of voters voting in the last preceding general election |
RCW 17.28.100 |
|
Park & Recreation District |
Regular |
60 percent |
40 percent of voters voting in the last preceding general election |
RCW 36.69.145 |
|
Park & Recreation Service Area |
Regular |
60 percent |
40 percent of voters voting in the last preceding general election |
RCW 36.68.525 |
Also:
|
Levy "Lid Lift" |
Regular |
Majority |
None |
RCW 84.55.050 |
B&O Inconsistency:
If there is such inconsistency can you describe or quantify it in some way that enables us to measure the weight of the problem?
RCW 35.21 requires a city that imposes a local B&O tax to do so by referendum. It also requires uniform rates for retailing and certain telephone services and establishes maximum rates that a city can levy without voter approval. There is no requirement for uniformity among cities imposing local B&O taxes, either as to rates on specifically defined activities, definitions of the activities themselves, or how income is apportioned. There is also no requirement that there be any uniformity with state B&O tax provisions. The legal authority to exercise this level of local control has been affirmed through various court decisions.
The Department of Revenue does not have sufficient knowledge of the differing local ordinances throughout the state, or detailed local business tax data, that would allow us to quantify the fiscal impact of creating uniformity within cities or between cities and the state. We are not aware of any other entity that possesses such capabilities.
In May 2001 Governor Locke directed the Department of Revenue to convene a Municipal Tax Work Group to address the issues with local B&O taxes. The file at the following link includes the Municipal Tax Work Group's November 2001 report to the Governor.
B&O tax on manufacturing:
Again the question of quantification, how serious is this as a practical matter? Have there been relocations of manufacturing facilities?
Here is a link to graphs showing (1) Washington share of U.S. manufacturing employment and (2) manufacturing jobs as a percent of the economy for Washington and the U.S. Washington's share of U.S. manufacturing jobs tends to be increasing until FY 1999. Manufacturing jobs, however, are declining as a share of both the U.S. and the Washington economy.
There is anecdotal information on firms that have left Washington and firms have located or expanded in Washington. The document at the link below is a list of both types of firms prepared from newspaper reports by the Department of Commerce and does not purport to be a complete list.
Decline in State Funding:
Is the charge that in real dollars state funding has declined over a long period a fact?
No this is not correct. This chart from the Office of Financial Management website provides a response to your question. An updated and more complete answer will take more analysis.
- State & Local Government Expenditures by Function
Note: link updated 4/3/2003 to replace expired original)
Washington taxes are regressive:
Is there consensus on this point among the studies?
It is generally accepted that Washington State's taxes are regressive based on estimates of taxes paid by households at different income levels. There have been two major studies in the last several years that rank Washington high in regressivity. The Citizens for Tax Justice in their 1996 study placed us on the "terrible 10" list for the highest burden in the nation on low income households and among the lowest burden for high income households. More recently the Washington, D.C. government conducted a study of the household burdens in the largest city of each state plus the District of Columbia. Seattle ranks 11th worst for its burden on low income families and 44th for tax burdens on high income families, ranking Seattle among the most regressive cities in the nation. An excerpt from the District of Columbia study is at this link:
The Citizens for Tax Justice study is at this link:
http://www.ctj.org/html/whopay.htm
Shifting Property Tax Burden:
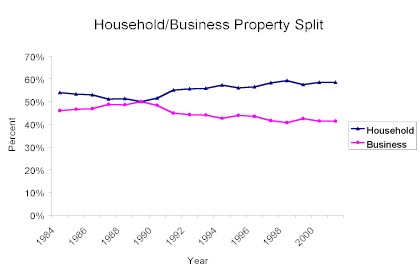
Was 70 percent business and 30 percent residential; now 50/50. Is this accurate?
The distribution of the property tax burden has shifted toward residential property in the last 20 years due primarily to a booming real estate market that has driven up the value of residential property faster than commercial property, and by a growth in new residential construction. A significant shift in property tax burden onto residential property occurred in 1983 when business inventories were removed by exemption from the property tax rolls. Unfortunately, records prior to 1984 are not available. Today, residential property bears almost 60 percent of the assessment and taxes from a low of 50 percent over the previous two decades. The chart below demonstrates this relationship.
Exemptions too prevalent:
One Assessor asserts $11.1 B collected while $20.7 exempt. Is this true? What are the major exemptions?
The Department of Revenue periodically estimates the savings to taxpayers from exemptions. In our latest report published in January 2000, we estimated that taxpayer savings from property tax total $4.5 billion for the 1999-01 Biennium, while revenues projected for the same sources are $2.6 billion.
Here is a list of the top 50 exemptions enacted after the 1935 Revenue Act:
-
Top 50 Exemptions
For a full list of all exemptions and a discussion, see Tax Exemptions 2000 on the Department of Revenue website.
"Back fill" exemptions:
What does this mean?
Under current law when property is exempted from taxation, the levy rate for each taxing district is automatically increased to compensate for the loss of value, such that the same amount of levy is collected. For regular levies, however, there are established statutory maximum rates that cannot be exceeded under any circumstances. Therefore, in some cases, taxing districts are not able to compensate for losses of valuation from exempted property through increased rates and they do experience a loss of revenue as a result. This process shifts the burden formerly borne by the now exempted property on to the remaining taxable property.
The idea of "back-fill" would not let this process occur but require the taxing districts not to adjust their levy rates upward to account for newly exempt property. Therefore, none of the remaining taxable property will experience any increase in property tax as a result of granting exemptions. The taxing districts would collect less property tax because of the newly exempted property. The loss in property tax for each district would be made up (back-filled) with money from the state. The constitution requires that all of the revenue from the state levy is devoted to schools, therefore, the state revenue would have to come from other sources, probably just a general fund appropriation.
Wage base for unemployment tax:
Is it the highest in the nation?
In 2001 Washington ranked 46th worst in the nation by a measure of unemployment insurance contributions collected as a percent of total wages (1.16 percent of wages). Among the reasons for our high rank is our high seasonal and cyclical employment (i.e., agriculture, fishing, food processing, and forest products). This measure is published every year in the Washington State Economic Climate Study, Office of the Forecast Council. For the full text of the current study, click on the following URL.