 Skip to main content
This interactive data graphic includes:
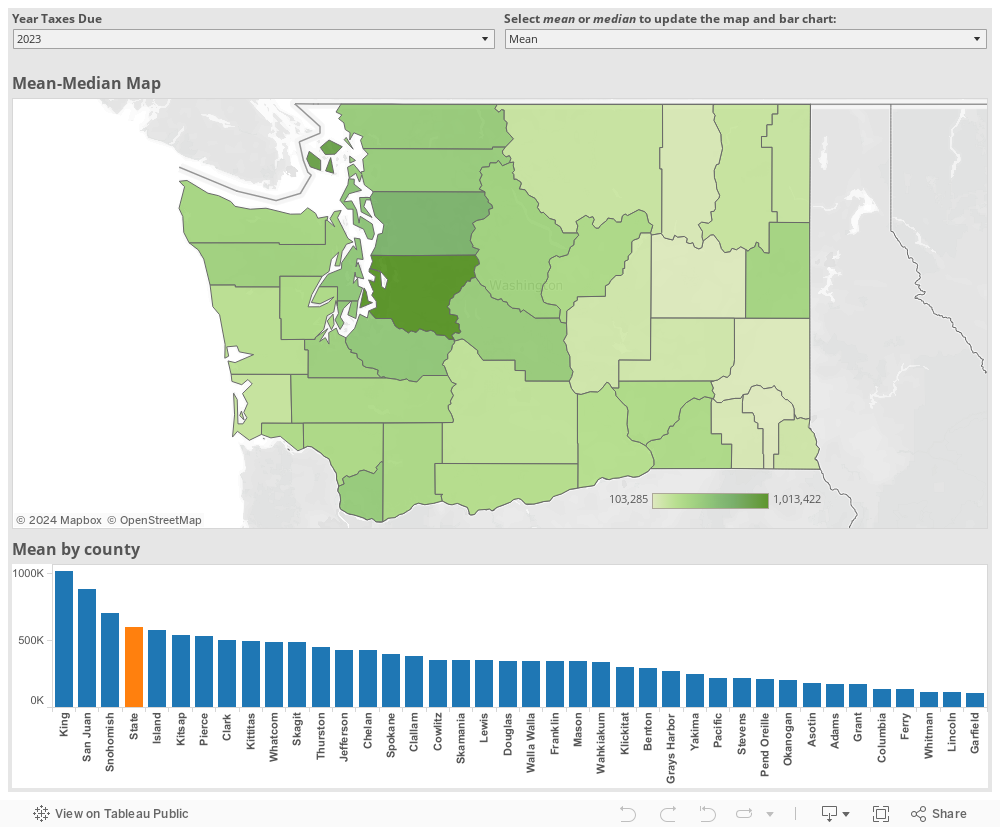
- The mean and median value of residential property by county
- Count of residential property parcels in $10,000 increments
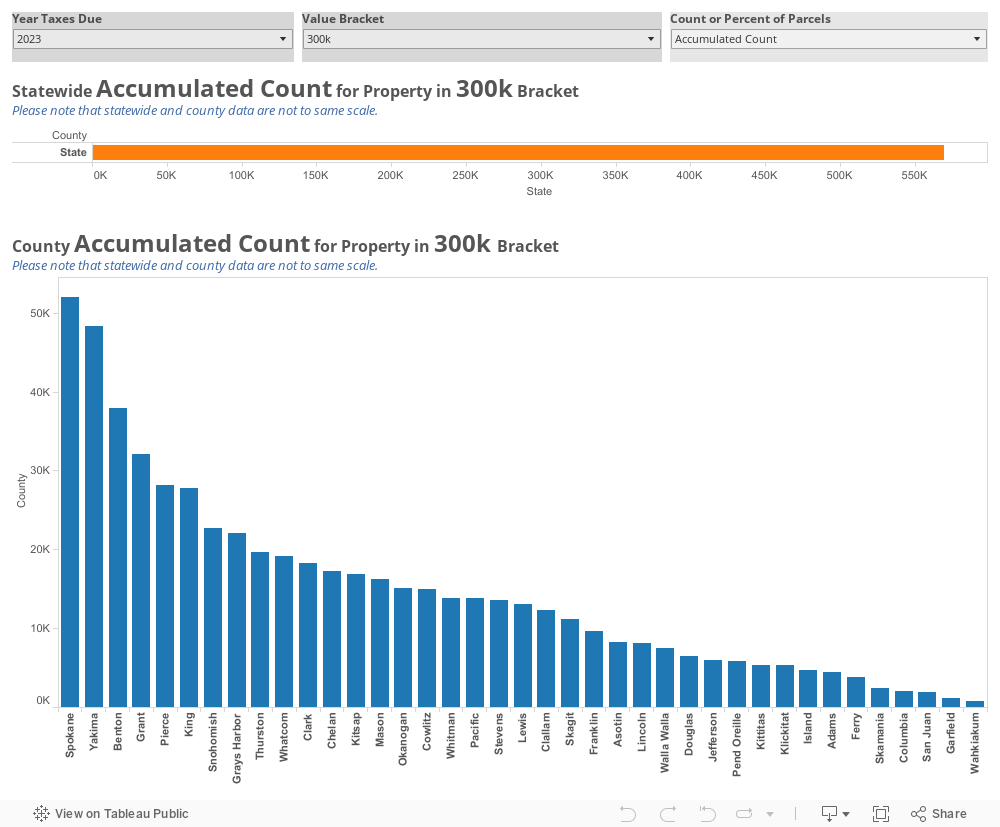
- Count of all residential property parcels valued below a specified value
Mean vs. Median
The mean sums all residential assessed value and divides by the number of parcels. The median orders all the parcels by value and equals the value of the parcel in the middle - so half of the parcels have values above the median and half have values below the median.
Residential Property Value
The county assessor determines the true and fair value of locally assessed real and personal property. Residential properties include single family homes, condominiums, vacation homes, cabins, and other residential property. The county assessor designates a property as residential.
Note: Data visualizations must be viewed in the Google Chrome, Firefox or Safari browsers.
A little about the data
Residential parcels include parcels with a building and exclude vacant or bare land parcels. Residential parcels may be owner occupied or non-owner occupied. The chart excludes parcels valued at more than $1 million, but the calculation of mean and median includes these parcels.
Charts
Many counties show a significant number or percentage of parcels valued at less than $10,000. These parcels tend to be older mobile homes on lease land or time-share units. Assessment methods assign low values to these parcels.
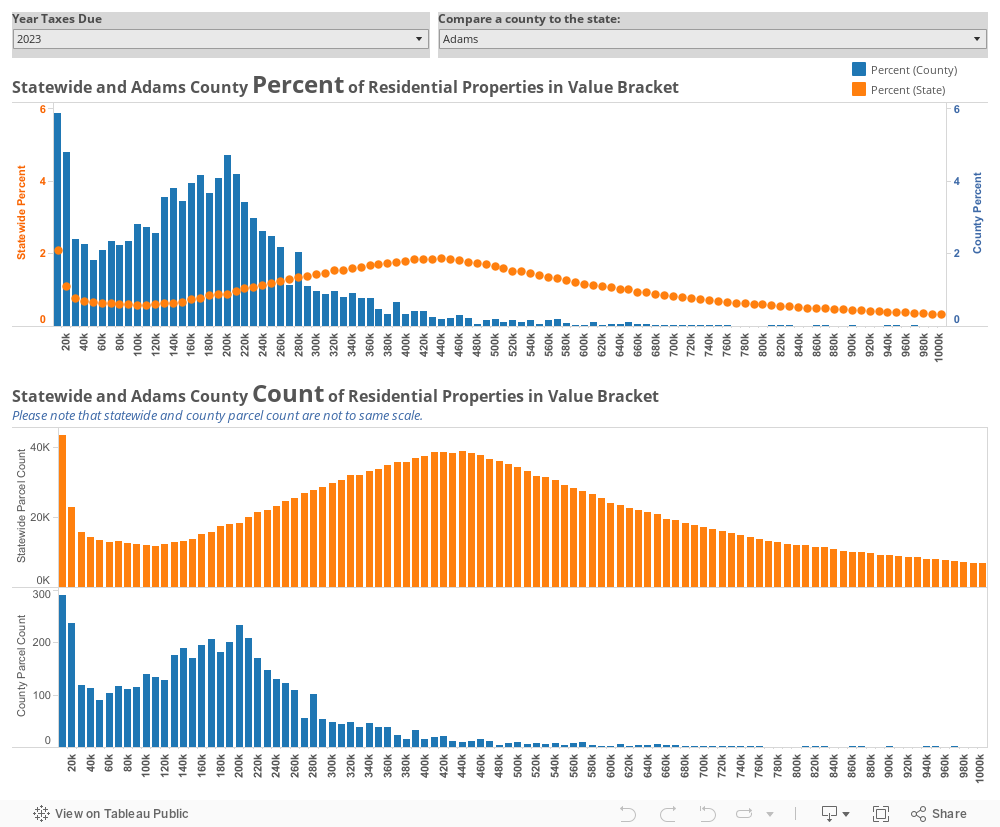
Compare the distribution and counts of residential values by county with statewide values. Each bar represents the number of parcels in a $10,000 value range. For example, the 80k bar represents the number or percentage of parcels valued between $70,000 and $80,000.
Residential Parcel Distribution
The first chart shows residential parcels as a percentage of the total parcels in the county. This distribution makes a comparison between the statewide distribution and a county's distribution possible.
Residential Parcel Value Count
The next set of charts shows the counts of residential parcels. Note the different scale on the vertical axis for each chart in this group. The low number of residential parcels in most counties does not allow for the same scale on both the county chart and statewide chart.
View the count or percent of parcels valued below a specified value. For example, select 150k to see the count or percent of residential parcels valued less than $150,000. Keep in mind that the statewide scale is different than the county scale.