 Skip to main content
Gains in construction and auto sales help fuel increase
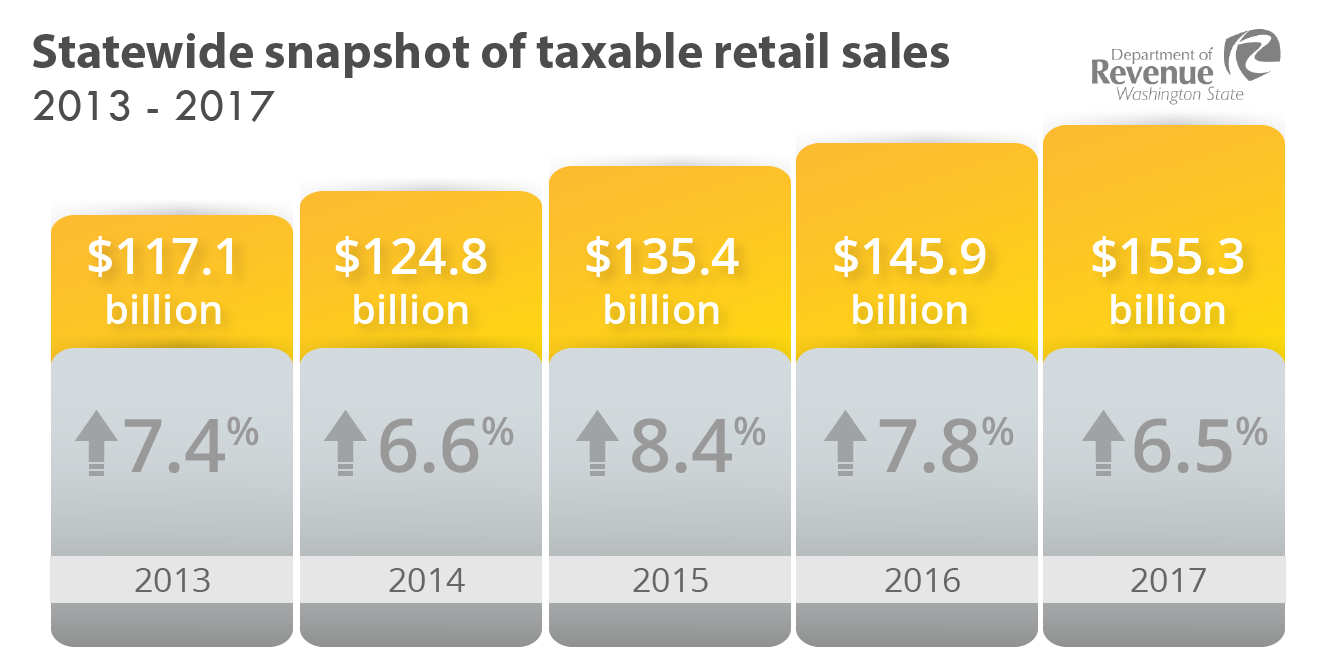
OLYMPIA, WASH. – June 6, 2018 – Continued gains in construction and auto sales sent taxable retail sales climbing to a record $155.3 billion in 2017, a 6.5 percent gain over calendar year 2016.
Retail trade sales also showed an increase of 5.6 percent to $66.7 billion in 2017.
Taxable retail sales includes transactions subject to the retail sales tax, including sales by retailers, the construction industry, manufacturing and other sectors. Retail trade is a subset of all taxable retail sales in the state and includes sales of items such as clothing, furniture and automobiles, but excludes other industries, such as services and construction.
These figures are part of an annual report released today by the Washington State Department of Revenue. The agency reports on a quarterly and annual basis the total taxable retail sales figures reported by businesses on their Washington tax returns. The agency uses Census Bureau classifications to report the sales revenues by sector.
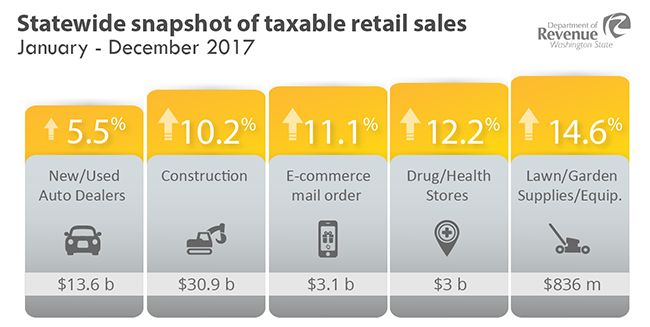
Some highlights of 2017 taxable retail and retail trade sales:
- Construction rose 10.2 percent to $30.9 billion.
- Taxable retail sales reported by new and used auto dealers increased 5.5 percent, reaching $13.6 billion.
- Taxable e-commerce and mail order sales increased 11.1 percent to $3.1 billion.
- Drug and health stores’ sales rose 12.2 percent to $3 billion.
- Lawn and garden supplies and equipment sales rose by 14.6 percent, reaching $836 million.
See calendar year 2017 taxable retail sales and retail trade sales by industry.
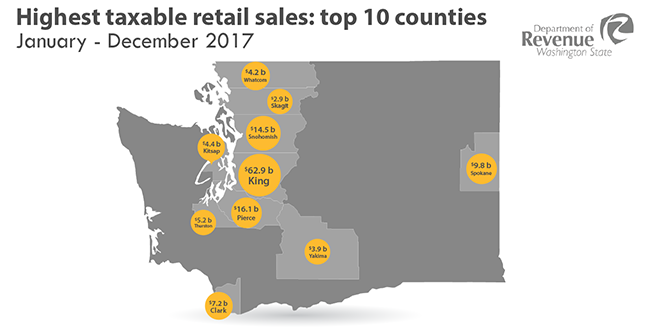
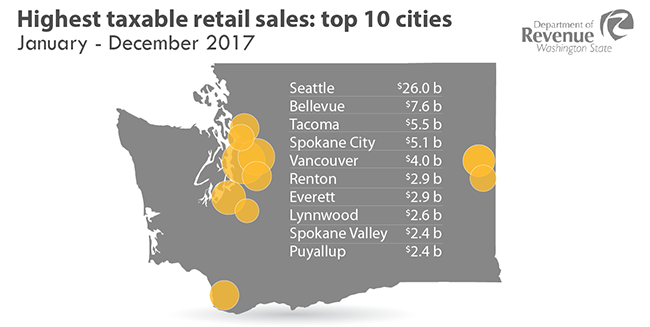
Of the top 10 most populated counties in the state, Clark and Whatcom counties enjoyed the largest overall taxable retail sales percentage increase. Tacoma and Vancouver saw the largest increase of the most populated cities.
See more details on the taxable retail sales and retail trade sales by industry for:
| County | Taxable retail sales | Percent change | Retail trade | Percent change |
|---|---|---|---|---|
| King | $62.9 billion | 5.7 | $22.5 billion | 4.6 |
| Pierce | $16.1 billion | 8.1 | $8.0 billion | 5.7 |
| Snohomish | $14.5 billion | 6.5 | $7.5 billion | 5.1 |
| Spokane | $9.8 billion | 7.7 | $4.7 billion | 4.6 |
| Clark | $7.2 billion | 10.6 | $3.2 billion | 8.4 |
| Thurston | $5.2 billion | 6.5 | $2.6 billion | 8.0 |
| Kitsap | $4.4 billion | 6.8 | $2.3 billion | 5.9 |
| Whatcom | $4.2 billion | 9.2 | $1.9 billion | 9.2 |
| Yakima | $3.9 billion | 2.3 | $1.9 billion | 6.1 |
| Skagit | $2.9 billion | 7.6 | $1.6 billion | 7.6 |
| City | Taxable retail sales | Percent change | Retail trade | Percent change |
|---|---|---|---|---|
| Seattle | $26.0 billion | 7.1 | $7.2 billion | 4.4 |
| Bellevue | $7.6 billion | 6.1 | $3.2 billion | 5.4 |
| Tacoma | $5.5 billion | 9.0 | $2.5 billion | 2.5 |
| Spokane City | $5.1 billion | 7.2 | $2.3 billion | 3.9 |
| Vancouver | $4.0 billion | 9.6 | $1.8 billion | 7.7 |
| Renton | $2.9 billion | (-0.3) | $1.5 billion | 2.4 |
| Everett | $2.9 billion | 4.7 | $1.4 billion | 2.5 |
| Lynnwood | $2.6 billion | 1.7 | $1.7 billion | 3.7 |
| Spokane Valley | $2.4 billion | 5.2 | $1.4 billion | 3.6 |
| Puyallup | $2.4 billion | 6.4 | $1.6 billion | 5.1 |
Check Revenue’s Retail sales for cities and counties page for more information about taxable retail sales for quarters 1 - 4 of 2017, and for previous years.
Check Revenue’s Statistics and Reports page for additional detail about taxable retail sales.
Understanding how businesses are classified
Revenue uses business tax return data to create this quarterly report. Businesses are categorized under the U.S. Census Bureau’s classification system based on their primary taxable activity. The North American Industry Classification System – or NAICS – is the same method federal statistical agencies use for the purpose of analyzing economic data.
# # #