 Skip to main content
Growth spurred by auto sales and construction
OLYMPIA – Feb. 21, 2018 – Summertime sales of new and used vehicles and steady growth in construction helped boost the state’s taxable retail sales in third quarter 2017. The sales increased by 7.3 percent over the same period in 2016, reaching $41.3 billion.
Retail trade, a subset of all taxable retail sales in the state, also increased by 6.6 percent to a total of $17.4 billion.
Taxable retail sales are transactions subject to the retail sales tax, including sales by retailers, the construction industry, manufacturing and other sectors. Retail trade includes sales of items such as clothing, furniture and automobiles, but excludes other industries, such as services and construction.
These figures are part of a quarterly report released today by the Washington State Department of Revenue. The taxable retail sales figures compare the same quarter year-over-year to equalize any seasonal effects that would influence consumer and business spending.
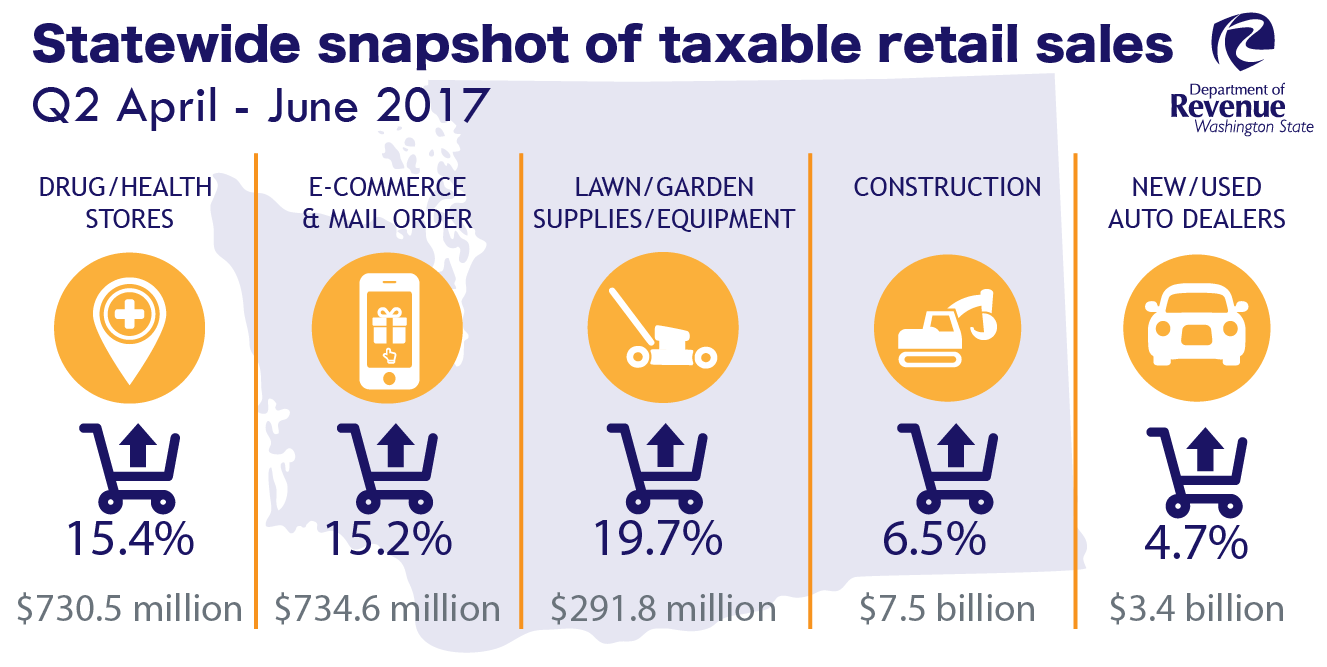
Some highlights of third-quarter 2017 (July – September) taxable retail sales and retail trade sales include:
- Construction rose 9.7 percent to $8.5 billion
- Taxable retail sales reported by new and used auto dealers increased 5.5 percent to $3.5 billion
- E-commerce and mail order sales increased 18.8 percent to $788 million*
- Drug and health store sales jumped 10.2 percent to $741 million
- Lawn and garden supplies and equipment rose by 14 percent to $202 million
See third-quarter 2017 taxable retail sales and retail trade sales by industry
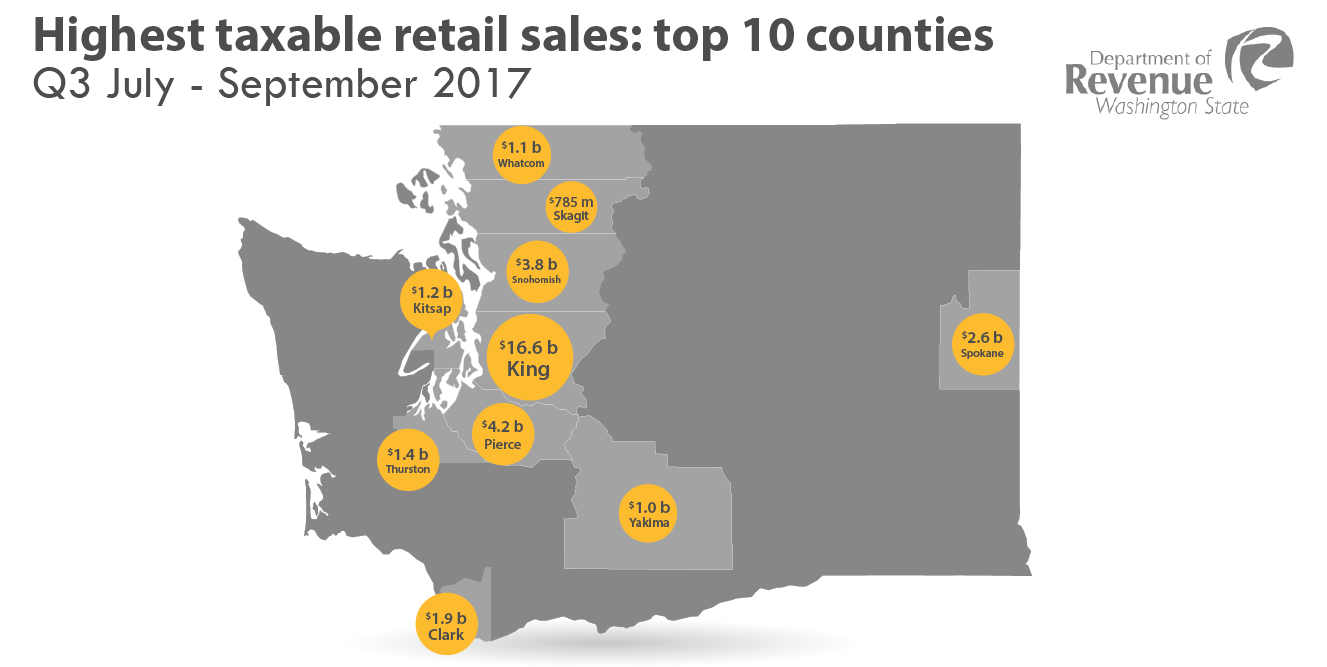
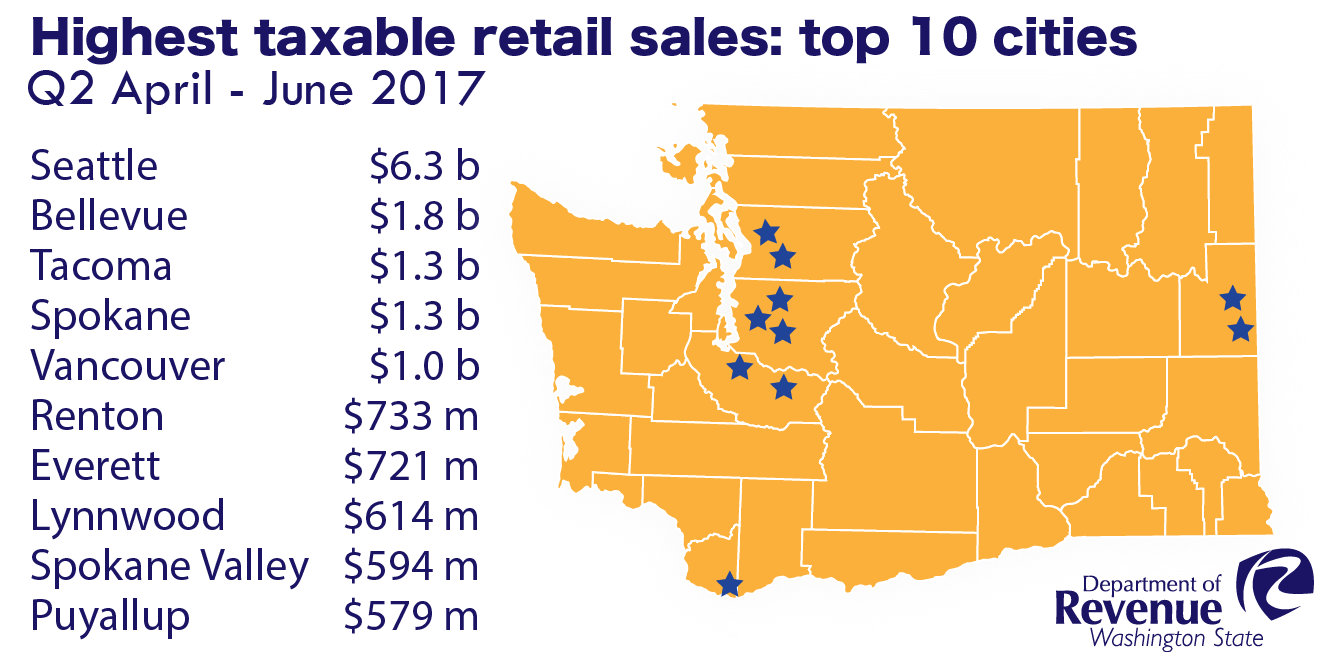
Of the top 10 most populated counties in the state, Clark and Whatcom counties enjoyed the largest overall taxable retail sales percentage increase. Tacoma and Vancouver saw the largest increase of the most populated cities.
| County | Taxable retail sales | Percent change | Retail trade | Percent change |
|---|---|---|---|---|
| King | $16.6 billion | 6.3 | $5.8 billion | 5.0 |
| Pierce | $4.2 billion | 9.3 | $2.1 billion | 6.1 |
| Snohomish | $3.8 billion | 7.7 | $2.0 billion | 6.2 |
| Spokane | $2.6 billion | 10.1 | $1.2 billion | 6.5 |
| Clark | $1.9 billion | 11.1 | $822 million | 10.5 |
| Thurston | $1.4 billion | 5.7 | $690 million | 9.8 |
| Kitsap | $1.2 billion | 5.4 | $600 million | 5.0 |
| Whatcom | $1.1 billion | 10.3 | $501 million | 9.2 |
| Yakima | $1.0 billion | 3.6 | $497 million | 9.1 |
| Skagit | $785 million | 7.3 | $422 million | 8.3 |
| City | Taxable retail sales | Percent change | Retail trade | Percent change |
|---|---|---|---|---|
| Seattle | $6.9 billion | 7.3 | $1.9 billion | 5.1 |
| Bellevue | $1.9 billion | 6.8 | $794 million | 4.3 |
| Tacoma | $1.4 billion | 11.8 | $641 million | 2.1 |
| Spokane City | $1.4 billion | 10.0 | $602 million | 4.3 |
| Vancouver | $1.0 billion | 10.1 | $463 million | 8.9 |
| Renton | $729 million | (-6.2) | $380 million | 0.9 |
| Everett | $771 million | 7.9 | $367 million | 4.3 |
| Lynnwood | $666 million | 2.9 | $429 million | 5.2 |
| Spokane Valley | $646 million | 6.7 | $380 million | 6.4 |
| Puyallup | $641 million | 7.5 | $425 million | 8.5 |
Check Revenue’s Statistics and Reports page for additional detail about taxable retail sales.
Understanding how businesses are classified
Revenue uses business tax return data to create this quarterly report. Businesses are categorized under the U.S. Census Bureau’s classification system based on their primary taxable activity. The North American Industry Classification System – or NAICS – is the same method federal statistical agencies use for the purpose of analyzing economic data.
*The taxable retail sales reported in the e-commerce and mail order category do not necessarily include online sales made by businesses with a bricks-and-mortar presence. Businesses categorized by this NAICS code identify their primary activity as online or mail order sales.
# # #